
The Edgeworth Box, named after the British economist Francis Ysidro Edgeworth, is a powerful tool in economic analysis. It offers insights into resource allocation, trade, and efficiency that have applications across various economic areas. In this post, we will explore the Edgeworth Box in detail, from its fundamental concepts to its real-world applications and contemporary relevance.
What is Edgeworth Box | Definition
The Edgeworth Box, also known as the Edgeworth-Bowley Box or Exchange-Bowley Box, is a graphical representation used by economists to analyze the allocation of goods between two individuals or entities. It provides a visual framework for understanding how resources are distributed in a way that maximizes utility or welfare for both parties.
See Also: Welfare Economics Explained | Definitions | Theorem | Types | Assumptions | Limitations
Francis Edgeworth is an influential economist of the late 19th and early 20th centuries, introduced this graphical tool in his groundbreaking work, “Mathematical Psychics: An Essay on the Application of Mathematics to the Moral Sciences” (1881). Edgeworth’s pioneering contributions laid the foundation for modern welfare economics and paved the way for the development of the Edgeworth Box.
Purpose and Significance of Edgeworth Box
The purpose and significance of the Edgeworth Box lie in its ability to provide valuable insights into resource allocation, gains from trade, and economic efficiency in various scenarios. Let’s see these aspects in detail:
-
Resource Allocation:
The Edgeworth Box offers a graphical representation of how resources, typically goods or commodities, are allocated between two individuals or entities. It provides a clear picture of the initial distribution of resources and how they can be reallocated to improve overall welfare.
By plotting the initial endowments of both parties and their preferences for different goods, the Edgeworth Box helps identify feasible allocations of resources. These are allocations that lie within the bounds of the initial endowments and are preferred by at least one party over their initial endowment.
The Edgeworth Box allows for the assessment of whether an allocation is Pareto efficient. An allocation is Pareto efficient when it is impossible to make one party better off without making the other worse off. This efficiency criterion is a central concept in welfare economics.
-
Analyzing Gains from Trade:
Within the Edgeworth Box, the contract curve represents all allocations where both parties are better off than their initial endowments. These points along the contract curve represent trade possibilities that result in mutual gains from trade.
Economists can measure the gains from trade by comparing the utility levels of parties at their initial endowments to their utility levels at points on the contract curve. This quantification of gains provides a basis for evaluating the benefits of trade and reallocation.
-
Evaluation of Efficiency:
The Edgeworth Box is instrumental in evaluating the efficiency of resource allocations. It allows economists to determine whether a given allocation represents a Pareto improvement, where at least one party is made better off without making anyone worse off. Pareto improvements are a key indicator of economic efficiency.
Efficiency vs. Inefficiency: By comparing allocations within the box, economists can identify inefficient allocations, where it is possible to reallocate resources to make at least one party better off without making anyone worse off. Identifying and rectifying such inefficiencies is a fundamental objective in economics.
-
Applications in Various Economic Domains:
The Edgeworth Box is widely used to analyze international trade scenarios, including tariff policies, trade agreements, and trade-offs between countries. It helps policymakers understand how trade can benefit both nations.
In labor markets, the Edgeworth Box aids in understanding wage negotiations and the distribution of income between labor and capital. It can highlight scenarios where both workers and employers can be made better off.
Environmental economics leverages the Edgeworth Box to assess the trade-offs between economic activities and environmental conservation. It helps determine the optimal allocation of resources to balance economic growth with environmental protection.
-
Decision-Making Tool:
The Edgeworth Box provides policymakers with a visual tool to assess the potential impacts of policy decisions. For instance, it can be used to evaluate tax policies, subsidies, and regulations to determine their effects on resource allocation and overall welfare.
In situations involving negotiations, such as labor disputes or trade agreements, the Edgeworth Box can serve as a negotiation aid. Parties can visually see where mutually beneficial agreements lie along the contract curve.
-
Educational Value:
The Edgeworth Box is a valuable pedagogical tool for teaching economics. It simplifies complex economic concepts, making them more accessible to students. It allows educators to illustrate economic theories and principles in a visual and interactive manner.
The Edgeworth Box’s purpose and significance extend across multiple dimensions of economics. It provides a framework for understanding resource allocation, trade, and efficiency, making it a vital tool for economists, policymakers, educators, and analysts. Its visual representation and analytical capabilities contribute to informed decision-making and a deeper understanding of economic phenomena.
Key Concepts in the Edgeworth Box
The Edgeworth Box, a fundamental tool in microeconomics, is rich in key concepts that help economists analyze resource allocation, trade, and efficiency. Let’s check these key concepts in detail:
- Initial Endowments: At the heart of the Edgeworth Box are the initial endowments of two economic agents. These endowments represent the quantities of goods or commodities each agent possesses before trade begins. The positions of these endowments on the box’s edges indicate the distribution of resources.
- Indifference Curves: Each agent’s preferences for consuming goods are depicted by their indifference curves within the box. Indifference curves are graphical representations of the various combinations of goods that provide the same level of utility (satisfaction) to the agent. These curves typically have a convex shape and slope downward, reflecting the principle of diminishing marginal utility.
- Contract Curve: The contract curve is a critical concept in the Edgeworth Box. It represents all the possible allocations of goods where both agents are equally happy, or, in economic terms, at the highest attainable level of utility. Points along the contract curve represent mutually beneficial trades where no one can be made better off without making the other worse off. This curve is central to analyzing efficient allocations and gains from trade.
- Pareto Efficiency: Pareto efficiency is a key concept in welfare economics, and the Edgeworth Box is instrumental in its analysis. An allocation of goods is Pareto efficient if no further reallocation can make at least one agent better off without making the other worse off. In the context of the Edgeworth Box, efficient allocations lie on the contract curve.
- Gains from Trade: The Edgeworth Box vividly illustrates the gains from trade. Comparing an initial endowment point to any point on the contract curve reveals the potential for both agents to improve their welfare through trade. These trade possibilities represent Pareto improvements, as they make at least one agent better off without harming the other.
- Feasible and Infeasible Allocations: Points inside the Edgeworth Box but outside the contract curve represent feasible allocations that are not Pareto efficient. Reallocation within the box can enhance overall welfare. In contrast, points outside the box are infeasible given the initial endowments and represent allocations that exceed the available resources.
- Resource Allocation Visualization: The Edgeworth Box provides a visual representation of how goods are allocated between two economic agents. It simplifies complex economic scenarios and aids in understanding the distribution of resources.
- Comparative Statics: Economists use the Edgeworth Box for comparative static analysis. By shifting initial endowment points, altering indifference curves, or changing preferences, they can explore how these factors affect resource allocation, trade possibilities, and efficiency.
- Applications: The Edgeworth Box finds applications in various economic contexts, including pure exchange economies, taxation analysis, environmental economics, game theory, and public policy. It offers insights into resource allocation and trade in both theoretical and real-world scenarios.
The Edgeworth Box is a versatile tool that helps economists visualize, analyze, and gain insights into resource allocation and trade between two agents. Its key concepts, such as Pareto efficiency and gains from trade, are central to understanding how markets function and how policies impact economic outcomes.
The Edgeworth Box Diagram
The Edgeworth Box Diagram, also known as the Edgeworth-Bowley Box, is a graphical representation used in economics to analyze the exchange of goods between two individuals, typically in the context of microeconomics and welfare economics. Here’s a detailed explanation of the Edgeworth Box Diagram:
-
Basic Structure:
The Edgeworth Box is a rectangular diagram, typically drawn as a square or a rectangle, representing an economy or a market.
It is divided into two equal parts, each representing the consumption bundle of one individual.
The horizontal axis (usually labeled as “X”) represents one type of good, while the vertical axis (labeled as “Y”) represents another type of good.
-
Endowment Points:
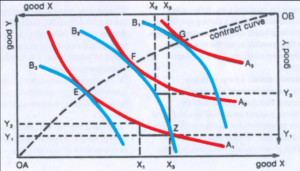
At the four corners of the Edgeworth Box, you’ll find the endowment points (A, B, C, and D), representing the initial allocation of goods between the two individuals.
Point A represents the entire allocation of good X to individual 1 and all of good Y to individual 2, while point C represents the reverse.
Points B and D represent an equal division of goods between the two individuals.
-
Indifference Curves:
Each individual has their set of indifference curves, representing their preferences for combinations of goods X and Y.
Indifference curves are typically convex and slope downwards, indicating the individual’s willingness to trade one good for the other while remaining equally happy (indifferent).
-
Contract Curve:
The contract curve (also known as the offer curve) is the locus of points where both individuals are equally satisfied (Pareto efficient) with the allocation of goods.
The contract curve typically starts at point B (equal division) and extends towards the center of the Edgeworth Box as a smooth curve.
All points on the contract curve are Pareto efficient because no individual can be made better off without making the other worse off.
-
Trade Line:
The trade line (often a straight line) represents all possible combinations of goods that can be traded between the two individuals.
Points inside the Edgeworth Box (between the contract curve and the trade line) represent potential trade opportunities where both individuals can benefit.
Points outside the trade line are unattainable given the initial endowments.
-
Gains from Trade:
The primary purpose of the Edgeworth Box is to illustrate the potential gains from trade.
When individuals trade along the contract curve, they can move to points that are higher on their indifference curves, signifying increased satisfaction or utility.
These gains from trade occur because resources are reallocated in a way that benefits both individuals without making anyone worse off.
-
Efficient Allocations:
Efficient allocations are represented by points on the contract curve. These allocations are Pareto efficient, meaning that it is impossible to reallocate goods to make one person better off without making the other worse off.
Inefficient allocations are those inside the Edgeworth Box but not on the contract curve.
-
Changes in Endowments or Preferences:
The Edgeworth Box can be used to analyze the effects of changes in initial endowments, preferences, or other factors.
Such changes can shift the contract curve, impacting the potential gains from trade and the distribution of goods.
Overall, the Edgeworth Box Diagram is a powerful tool for illustrating the concepts of efficiency, trade, and Pareto optimality in microeconomics. It helps economists and policymakers visualize and analyze the allocation of resources and the potential benefits of trade between individuals or entities.
How to Draw Edgeworth Box Diagram
Drawing an Edgeworth Box is a straightforward process and can be done by following these steps. In this example, we’ll create a basic as above Edgeworth Box for two individuals (A and B) and two goods (X and Y):
Set Up the Graph:
- Start by drawing a large square or rectangle on your paper. This will be your Edgeworth Box.
- Label the horizontal axis as “X” and the vertical axis as “Y.” These axes represent the quantities of the two goods being exchanged.
Plot the Initial Endowments:
- Determine the initial endowments of goods for individuals A and B. These are the quantities of goods X and Y that each person starts with.
- For example, let’s say A has 10 units of X and 5 units of Y, and B has 5 units of X and 10 units of Y.
- On the X-axis, measure 10 units to the right from the origin (0,0) and make a small mark. This represents A’s endowment of X.
- On the Y-axis, measure 5 units up from the origin and make a small mark. This represents A’s endowment of Y.
- Repeat the process for individual B’s endowment, but plot it on the opposite side of the box.
Draw the Indifference Curves:
- Draw the indifference curves for individuals A and B. These curves represent their preferences for goods X and Y.
- Indifference curves are typically convex to the origin, indicating diminishing marginal rates of substitution.
- Use a compass or draw the curves freehand. Make sure they do not cross within the box.
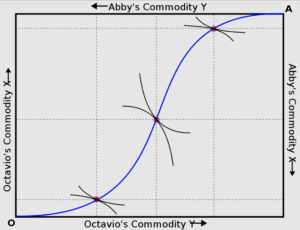
Find Points of Tangency:
- Locate points where the indifference curves of A and B are tangent to each other. These points represent potential trade-offs that are mutually beneficial.
- Draw a small dot or mark at each point of tangency.
Connect the Dots:
- Connect the dots representing points of tangency to form the contract curve. The contract curve should stay within the boundaries of the Edgeworth Box.
Label the Axes and Curve:
- Label the horizontal and vertical axes as “X” and “Y,” respectively.
- Label the contract curve as “Contract Curve.”
Optional Details:
- You can add additional details to your Edgeworth Box, such as axis labels, numerical values, or shading to indicate the area of possible allocations.
Final Touches:
- Review your Edgeworth Box to ensure accuracy and clarity.
That’s it! You’ve successfully drawn an Edgeworth Box representing the exchange possibilities between two individuals with initial endowments of goods X and Y. The contract curve within the box illustrates the potential mutually beneficial trade-offs that can be achieved through voluntary exchange.
Edgeworth Box Contract Curve | How to Find It
The contract curve within the Edgeworth Box is a critical concept that helps us understand the possible outcomes of such exchanges. Let’s check the details of the Edgeworth Box contract curve.
The Contract Curve
- The contract curve is a curve that represents all the possible allocations of goods (bundles) that can be achieved through voluntary exchange between individuals A and B.
- It lies inside the Edgeworth Box, connecting points where one individual is better off without making the other worse off.
- The contract curve reflects the efficient allocations of goods that result from trading, maximizing the total utility or well-being of both individuals.
Features of the Contract Curve:
- Pareto Efficiency: All points on the contract curve are Pareto-efficient allocations, meaning that no further exchanges can make one person better off without making the other worse off.
- Tangency: At any point on the contract curve, the individuals’ indifference curves (representing their preferences) are tangential, indicating that they are willing to trade goods at the same marginal rate of substitution (MRS).
- Shape: The shape of the contract curve can vary based on the initial endowments, preferences, and relative bargaining power of A and B. It may be convex, concave, or linear.
Determining the Contract Curve:
- To find the contract curve, start by plotting the initial endowments of goods for A and B as two points on the edges of the Edgeworth Box.
- Identify the initial indifference curves for A and B, which represent their preferences.
- Move along these indifference curves to find points where the individuals are equally well off (equally happy).
- Connect these points to form the contract curve, which shows the possible mutually beneficial trade-offs.
Implications and Analysis:
The contract curve provides insights into the distribution of goods resulting from trade. It showcases the potential gains from trade and the possibilities for improving both individuals’ welfare.
The specific position and shape of the contract curve depend on factors such as initial endowments, preferences, and the terms of trade (exchange ratios).
The contract curve in the Edgeworth Box is a visual representation of the efficient allocations of goods that can be achieved through voluntary exchange between two individuals. It highlights the potential for mutually beneficial trade and is a valuable tool in understanding microeconomic concepts related to exchange and allocation.
Limitations and Assumptions of Edgeworth Box
The Edgeworth Box is a powerful tool for analyzing resource allocation, but like any economic model, it has its limitations and relies on certain assumptions. Let’s explore these limitations and assumptions:
Limitations:
- Two-Agent Framework: The Edgeworth Box is designed for a simplified scenario with only two economic agents. In the real world, there are often many more buyers and sellers in markets, making its direct application to complex situations challenging.
- Two-Good Model: The model typically deals with only two goods or commodities. While this simplicity aids in graphical representation, real-world economies involve numerous goods and services with varying characteristics, making the analysis more intricate.
- Constant Preferences: The Edgeworth Box assumes that agents’ preferences remain constant throughout the analysis. In reality, people’s preferences can change over time, which can affect resource allocation and trade patterns.
- Perfect Competition: The model assumes perfect competition, which is rarely found in real markets. Imperfections like market power, information asymmetry, and externalities are common in actual economies and can significantly impact outcomes.
- Homogeneity: The Edgeworth Box assumes that goods are homogeneous and identical. In many real-world situations, goods may have differentiated features, qualities, or brand preferences, leading to more complex trade dynamics.
- No Production: It focuses exclusively on exchange and consumption, omitting the production side of the economy. In reality, production decisions, technology, and costs play a crucial role in resource allocation.
Assumptions
- Rationality: The model assumes that economic agents are rational decision-makers who aim to maximize their utility or satisfaction. While rationality is a useful simplifying assumption, it doesn’t always reflect real-world behavior accurately.
- Fixed Endowments: The initial endowments of goods are assumed to be fixed and unalterable. In reality, agents can acquire or dispose of goods through production, trade, or other means, which the model doesn’t consider.
- Perfect Information: The model assumes perfect information, meaning that agents have complete knowledge of market conditions, prices, and each other’s preferences. In real markets, information is often imperfect, leading to uncertainty and information asymmetry.
- No Externalities: Externalities, which are side effects of economic activities affecting third parties, are not considered in the Edgeworth Box. In practice, externalities can have significant economic and social implications.
- No Transaction Costs: The model assumes frictionless exchanges with no transaction costs. In real markets, transaction costs like taxes, fees, and transportation expenses can influence trade patterns.
- No Income or Wealth Effects: The Edgeworth Box doesn’t account for income or wealth effects. Changes in income or wealth can alter preferences and consumption patterns, affecting resource allocation.
- Utility Functions: It assumes that utility functions are well-behaved, continuous, and differentiable. In some cases, agents may have utility functions with discontinuities or other complexities.
- No Market Failures: The model assumes perfectly functioning markets without any market failures. Real markets can experience various market failures, such as monopolies, externalities, or public goods problems, which affect resource allocation.
The Edgeworth Box is a valuable tool for illustrating resource allocation and trade possibilities, but it simplifies the real-world economy and relies on several assumptions. When applying the model to practical scenarios, economists should consider its limitations and the extent to which its assumptions align with the specific context under analysis.
Extensions and Variations of Edgeworth Box
The Edgeworth Box, originally designed to analyze the exchange of two goods between two individuals, has been extended and modified to address more complex economic situations. Here, we’ll explore some of the extensions and variations of the Edgeworth Box:
-
Three- and Multi-Agent Edgeworth Box:
The traditional Edgeworth Box focuses on two individuals. Extensions involve adding more agents, often in the form of additional boxes representing their preferences and endowments.
Multi-agent Edgeworth Boxes are useful for analyzing resource allocation, trade, and bargaining among multiple participants, such as consumers, firms, or countries.
-
Production in the Edgeworth Box:
While the classic Edgeworth Box focuses solely on the exchange of goods, extensions incorporate production possibilities within the framework.
Agents can now produce goods, which introduces the concept of production possibility frontiers. This extension allows for the analysis of production, exchange, and consumption decisions.
-
Public Goods and Externalities:
Extensions of the Edgeworth Box can incorporate public goods and externalities by including collective goods that affect all agents’ utility.
The model can illustrate situations where individuals’ preferences and willingness to pay for public goods differ, leading to discussions about efficient provision and government intervention.
-
Taxation and Subsidies:
In some variations, tax and subsidy policies are included in the Edgeworth Box to examine their effects on resource allocation.
Taxes and subsidies can change the relative prices of goods and influence individuals’ consumption and production decisions.
-
Endowment Changes:
Extensions consider scenarios where agents’ initial endowments of goods change over time. This can result from factors like inheritance, gifts, or production.
Analyzing endowment changes provides insights into how wealth redistribution affects trade and welfare.
-
Uncertainty and Risk:
Extensions introduce uncertainty and risk by allowing agents to have subjective probability distributions over goods’ qualities or future prices.
This variation addresses how risk aversion and uncertainty impact trade and allocation decisions.
-
Asymmetric Information:
Edgeworth Box extensions can incorporate asymmetric information, where some agents have more information than others about goods’ qualities or values.
This reflects real-world situations where buyers and sellers may possess different levels of information, leading to information-related market failures.
-
Dynamic Edgeworth Box:
Some extensions add a time dimension, allowing agents to make sequential decisions over time.
This dynamic approach can analyze intertemporal trade, investment, and consumption choices.
-
Imperfect Competition:
Modifications of the Edgeworth Box can accommodate situations of imperfect competition, such as monopolistic or oligopolistic markets.
Analyzing imperfect competition within the framework helps assess the effects of market power on trade and welfare.
-
Environmental and Sustainability Considerations:
Extensions may incorporate ecological or sustainability dimensions, considering goods that have environmental impacts or exhaustible resources.
This variation allows economists to explore trade-offs between economic efficiency and environmental conservation.
-
Behavioral Economics Insights:
Behavioral economics findings can be integrated into the Edgeworth Box framework to study deviations from perfect rationality and utility maximization.
This extension helps analyze how cognitive biases and bounded rationality affect economic decisions.
Extensions and variations of the Edgeworth Box provide economists with versatile tools to analyze a wide range of economic phenomena. These adaptations enable the model to address complexities beyond the simple exchange of two goods between two individuals, making it a valuable framework for understanding real-world economic scenarios.
Comparison of the Edgeworth Box to other Models
The Edgeworth Box is a powerful graphical tool for analyzing resource allocation and exchange in economics. However, it’s essential to understand how it compares to other economic models and frameworks to appreciate its strengths and limitations fully. Let’s explore a detailed comparison of the Edgeworth Box to other models:
-
PPF (Production Possibility Frontier):
Edgeworth Box: Focuses on the exchange of goods between two individuals while assuming fixed endowments.
PPF: Examines the production possibilities of an entire economy, showing the trade-offs between producing different goods with limited resources.
The Edgeworth Box complements PPF by providing a micro-level analysis of individual exchange within the broader context of an economy’s production possibilities.
-
Supply and Demand Diagram:
Edgeworth Box: Considers individual preferences and initial endowments to analyze trade outcomes.
Supply and Demand Diagram: Illustrates market-level interactions between buyers and sellers to determine equilibrium prices and quantities.
While the Edgeworth Box offers insights into individual utility and Pareto efficiency, the supply and demand diagram is better suited for examining market-clearing conditions and price determination.
-
General Equilibrium Model:
Edgeworth Box: A partial equilibrium model focusing on a specific exchange scenario between two individuals.
General Equilibrium Model: Analyzes the simultaneous interactions of all agents and markets within an economy to determine prices, quantities, and allocations.
The Edgeworth Box is a simplified representation suitable for microeconomic analysis, while general equilibrium models provide a comprehensive view of an entire economy’s interactions.
-
Monopoly and Oligopoly Models:
Edgeworth Box: Often assumes competitive markets and perfect competition.
Monopoly and Oligopoly Models: Examine situations with market power, where a single firm (monopoly) or a few firms (oligopoly) dominate the market.
The Edgeworth Box is less suitable for modeling market power and strategic behavior, making monopoly and oligopoly models more appropriate for those scenarios.
-
Game Theory:
Edgeworth Box: Primarily focuses on trade outcomes and Pareto efficiency.
Game Theory: Analyzes strategic interactions among rational agents to predict their choices and outcomes.
Game theory extends beyond the Edgeworth Box by considering strategic behavior, cooperation, and competition in various settings, including economics and other disciplines.
-
Public Goods Models:
Edgeworth Box: Usually does not incorporate public goods and externalities.
Public Goods Models: Study the provision and consumption of public goods that benefit all individuals, regardless of their contributions.
Public goods models address issues related to collective consumption and free riding, which the Edgeworth Box is not designed to explore.
-
Behavioral Economics Models:
Edgeworth Box: Assumes rational, utility-maximizing agents.
Behavioral Economics Models: Consider deviations from rationality, incorporating insights from psychology and behavioral science.
Behavioral economics models accommodate human biases and bounded rationality, while the Edgeworth Box is a classical framework based on rationality assumptions.
The Edgeworth Box is a valuable tool for microeconomic analysis, especially for understanding exchange and Pareto efficiency. However, it is just one of many models and frameworks in economics, each tailored to address specific aspects of economic behavior, markets, and interactions. Economists often choose the most appropriate model or combination of models based on the specific research questions and phenomena they aim to investigate.
Practical Applications of the Edgeworth Box
The Edgeworth Box, a graphical representation of exchange and allocation in economics, has practical applications in various economic contexts. Let’s explain its real-world applications in detail:
-
International Trade Analysis:
The Edgeworth Box can be used to illustrate the gains from international trade by comparing the consumption possibilities of two countries before and after trade. Economists use the Edgeworth Box to explain how countries can benefit from specializing in the production of goods in which they have a comparative advantage and then trading those goods with other nations.
-
Environmental Resource Allocation:
When managing shared environmental resources, such as water or fisheries, the Edgeworth Box helps visualize the trade-offs between different users’ allocations. Policymakers use the Edgeworth Box to design allocation mechanisms that promote efficiency and reduce conflicts over resource use, often involving tradable permits or quotas.
-
Public Finance and Taxation:
Governments use the Edgeworth Box to analyze the impact of tax policies and distributional effects on consumers and producers. It helps policymakers understand how different tax structures, such as progressive or regressive taxes, affect income distribution and overall welfare.
-
Urban Planning and Land Use:
Planners use the Edgeworth Box to allocate land for various uses, considering factors like residential, commercial, and recreational spaces. This application helps optimize land use while accounting for competing demands and preferences, ensuring efficient land allocation in urban areas.
-
Resource Management in Agriculture:
Farmers and agricultural policymakers use the Edgeworth Box to determine the optimal allocation of resources like land, labor, and capital among different crops or farming practices. It aids in maximizing agricultural output, minimizing resource waste, and optimizing land use for sustainable farming.
-
Allocation of Public Goods:
The Edgeworth Box can be applied to public goods and services provision, where the efficient allocation of resources among different public goods is essential. Governments use this tool to allocate budgets to public services like education, healthcare, and infrastructure, aiming to maximize overall societal welfare.
-
Industrial Organization and Market Structure:
Businesses and regulators employ the Edgeworth Box to understand market dynamics, especially in cases of duopoly or oligopoly. Analyzing consumer and producer surpluses in an Edgeworth Box helps firms strategize pricing and output decisions, and regulators assess competition levels and intervene as necessary.
-
Auction Design:
Auctioneers and bidders use the Edgeworth Box to model different auction formats and strategies. It assists in designing efficient auction mechanisms, such as first-price sealed-bid or second-price sealed-bid auctions, for various types of goods and services.
-
Healthcare Resource Allocation:
Healthcare planners and policymakers apply the Edgeworth Box to allocate medical resources, such as hospital beds or organ transplants, equitably. It helps optimize the allocation process, ensuring that resources go to those who need them most and maximizing overall health outcomes.
-
Labor Market Analysis:
Labor economists use the Edgeworth Box to study wage determination and income distribution between labor and capital. It provides insights into the impact of labor market policies, minimum wage laws, and labor union negotiations on labor market outcomes.
In these practical applications, the Edgeworth Box facilitates visualizing and analyzing complex allocation decisions, helping stakeholders make informed choices that promote efficiency and enhance overall welfare. Its versatility makes it a valuable tool across various fields within economics and public policy.
Conclusion
The Edgeworth Box remains an indispensable tool in economics. Its ability to visualize and analyze resource allocation, gains from trade, and efficiency makes it a cornerstone of economic analysis. As we navigate complex economic challenges, the Edgeworth Box serves as a guiding light, helping economists and policymakers make informed decisions for the betterment of society.
Edgeworth Box | Concepts | Diagram | Contract Curve | Limitations | Assumptions | Examples | PDF Free Download |