

Understanding consumer preferences and choices is crucial to unraveling the complexities of human decision-making. One tool that aids in this endeavor is the concept of indifference curves. These curves provide valuable insights into how consumers make choices, weighing the trade-offs between goods and services. Below this post is all about indifference curve.
What is Indifference Curve
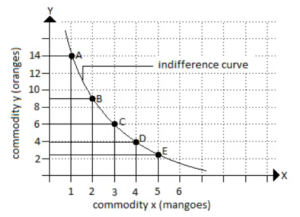
A graphical representation of how consumers make choices among different combinations of goods and services, known as indifference curve. It illustrates all the combinations of two goods that provide the consumer with the same level of satisfaction or utility. In simpler terms, it helps us understand the trade-offs a consumer is willing to make between two goods while remaining equally satisfied.
Basic Concepts of Indifference Curves
In the world of microeconomics, understanding consumer preferences and choices is paramount. One of the foundational tools used to analyze these preferences is the indifference curve. Let’s check below the basic concepts of indifference curve.
See Also: What is Consumer Surplus | How to Calculate It | Graph | Factors | Limitations
- Utility and Consumer Preferences: At the core of indifference curves lies the concept of utility, which represents the satisfaction or happiness a consumer derives from consuming goods and services. Indifference curves depict how consumers rank different combinations of goods based on their preferences and utility.
- Rational Consumer Behavior: Indifference curves assume that consumers are rational decision-makers. This means they aim to maximize their utility given their budget constraints and the prices of goods.
How to Draw Indifference Curves
It’s essential to understand how indifference curve is made and what’s it reveals about the decision-making process. Let’s check below how to build an indifference curve.
- Identifying Preferences: To construct an indifference curve, it’s crucial to know the consumer’s preferences. This can be done through surveys, experiments, or observations to understand which combinations of goods provide the same level of satisfaction.
- Plotting Combinations: Once preferences are identified, plot various combinations of goods on a graph. For simplicity, let’s assume two goods, X and Y, are on the axes. The consumer’s preferences determine which points lie on the indifference curve.
- Utility Levels: Assign utility levels to each combination of goods. Higher utility levels are closer to the consumer’s preferred combinations, indicating greater satisfaction.
- Connecting the Dots: Connect the points on the graph to form the indifference curve. The curve should be smooth, reflecting the assumption of continuous preferences.
Understanding the Insights
- Marginal Rate of Substitution (MRS): As you move along the indifference curve from left to right, the MRS decreases. This means that the consumer is willing to trade less of one good for more of the other as they have more of the latter. The slope of the indifference curve at any point represents the MRS at that point.
- Consumer Preferences: The shape and position of the indifference curve reveal the consumer’s preferences. If the curve is steeper, it indicates that the consumer values one good more than the other. If it shifts outward, it represents an increase in overall utility.
Practical Implication
- Consumer Equilibrium: Indifference curves are instrumental in understanding consumer equilibrium, where the consumer maximizes their utility given their budget constraints. Consumer equilibrium occurs when the indifference curve is tangent to the budget constraint line.
- Consumer Surplus: The area between the consumer’s indifference curve and the budget constraint line represents consumer surplus, which is the extra satisfaction derived from paying less than the maximum price.
Building an indifference curve is a fundamental step in understanding consumer preferences and choices. These curves offer valuable insights into how consumers make trade-offs between goods to maximize their utility.
Understanding the Indifference Curve Graph
Indifference curves are a fundamental concept in microeconomics, offering a graphical representation of consumer preferences. These graphs or maps help economists and analysts understand how consumers make choices among different combinations of goods and services while remaining equally satisfied. Let’s check below the indifference curve graph in detail.
-
Introduction to the Indifference Curve Graph
Utility and Satisfaction: At its core, the indifference curve graph is a visual tool that captures the relationship between two goods or commodities. It helps us understand how consumers derive utility, or satisfaction, from consuming these goods.
Consumer Preferences: The graph illustrates the various combinations of two goods that provide the same level of satisfaction or utility to the consumer. It is instrumental in deciphering consumer preferences and trade-offs.
-
The Elements of an Indifference Curve Graph
The Axes: In a typical indifference curve graph, one good is plotted on the x-axis, and the other good is plotted on the y-axis. These axes represent the quantities consumed of each good.
Indifference Curves: The actual indifference curves are the graphical representations of consumer preferences. These curves depict combinations of goods that provide the consumer with equal levels of satisfaction.
Utility Levels: Each indifference curve corresponds to a specific utility level. Higher curves represent higher utility levels, indicating greater satisfaction for the consumer.
-
Characteristics of the Indifference Curve Graph
Downward Sloping: One of the key features of indifference curves is their downward-sloping nature. As you move along an indifference curve from left to right, it represents the trade-off the consumer is willing to make between the two goods to maintain the same level of satisfaction.
Convexity to the Origin: Indifference curves are typically convex to the origin. This curvature signifies the diminishing marginal rate of substitution (MRS). In other words, consumers are willing to give up one good for another at a diminishing rate.
Non-Intersecting: Indifference curves never intersect with each other. If they did, it would imply that two different combinations of goods provide the same level of satisfaction, which contradicts the concept of consumer preferences.
-
Building the Indifference Curve Graph
Consumer Preferences: Constructing an indifference curve graph begins with understanding the consumer’s preferences. This is often determined through surveys, experiments, or observed behavior.
Plotting Combinations: Once preferences are identified, various combinations of goods are plotted on the graph, with different points representing different combinations.
Connecting the Dots: The next step is to connect these points to form the indifference curve. The curve should be smooth, reflecting the assumption of continuous preferences.
-
Interpretation and Insights
Marginal Rate of Substitution (MRS): The slope of an indifference curve at any point represents the marginal rate of substitution (MRS) at that point. This quantifies how much of one good the consumer is willing to give up to gain an additional unit of the other while maintaining the same level of satisfaction.
Preference Rankings: The indifference curve graph allows economists to rank bundles of goods based on consumer preferences. Higher indifference curves indicate higher levels of satisfaction.
Consumer Equilibrium: Consumer equilibrium is achieved when the indifference curve is tangent to the budget constraint line. This point represents the optimal allocation of resources to maximize utility within the budget.
-
Practical Applications
Market Analysis: In market analysis, indifference curve graphs are used to predict how changes in prices and consumer incomes will impact demand for different goods.
Policymaking: Policymakers use these graphs to understand how economic policies, such as taxation or subsidies, can affect consumer behavior and market dynamics.
The indifference curve graph is a powerful tool that helps economists and analysts decipher the complex world of consumer preferences and choices. By representing these preferences graphically, it provides valuable insights into how consumers allocate their resources among different goods and services while striving to maximize their satisfaction.
See Also: Law of Supply | Graph | Table | Assumptions | Limitations | Elasticity
Types of Indifference Curves
Indifference curves are a foundational concept in microeconomics, providing a graphical representation of consumer preferences and choices. These curves come in various shapes and forms, reflecting different patterns of consumer behavior. Let’s check below the various types of Indifference curves.
-
Convex Indifference Curves
Convex indifference curves are among the most common types encountered in microeconomics. They exhibit a bowed-out shape, curving away from the origin. This curvature signifies a diminishing marginal rate of substitution (MRS) as the consumer moves along the curve.
Convex indifference curves reflect the principle of diminishing marginal utility. As consumers consume more of one good, they are willing to give up fewer units of another to maintain the same level of satisfaction. This type of curve aligns with typical preferences where consumers value diversity in their consumption choices.
-
Linear (Perfect Substitutes) Indifference Curves
Linear indifference curves are straight lines that emanate from the origin. They indicate that the two goods under consideration are perfect substitutes for one another, meaning consumers are willing to trade one good for another at a constant rate.
Linear indifference curves suggest that consumers view the two goods as equivalent in their satisfaction. In this case, the marginal rate of substitution (MRS) is constant along the curve. This type of preference is relatively rare in practice but is useful for understanding specific situations, such as utility-maximizing production processes.
-
L-Shaped (Perfect Complements) Indifference Curves
L-shaped indifference curves form an L-like shape, with a right angle at the origin. This pattern indicates that the two goods are perfect complements, meaning consumers consume them in fixed proportions.
In the case of perfect complements, consumers always consume both goods in the same ratio. They derive no additional satisfaction from consuming more of one good without an equal increase in the other. L-shaped indifference curves are relatively rare in consumer choices but can apply to scenarios like left and right shoes.
-
Concave (Quasi-Concave) Indifference Curves
Concave indifference curves have a bowed-inward shape, curving toward the origin. This curvature implies that the consumer exhibits increasing marginal rate of substitution (MRS) as they move along the curve.
Concave indifference curves suggest that consumers are willing to trade off goods at an increasing rate. This indicates a preference for variety in consumption. Such curves are often used to model real-world preferences, where consumers value diversity in their choices.
-
Non-Intersecting Indifference Curves
Indifference curves never intersect with each other. Each curve represents a unique level of satisfaction or utility for the consumer.
Non-intersecting indifference curves allow economists to rank bundles of goods based on consumer preferences. Higher indifference curves indicate greater satisfaction for the consumer. The absence of intersections ensures that different combinations of goods provide distinct levels of utility.
-
Well-Behaved Indifference Curves
Well-behaved indifference curves exhibit consistent patterns of behavior, such as being smooth, continuous, and devoid of kinks.
Well-behaved indifference curves are used for theoretical analysis and ease of interpretation. They provide a clear visual representation of consumer preferences and trade-offs.
Indifference curves come in various types, each shedding light on different aspects of consumer behavior and preferences. Understanding these types is essential for economists and analysts to make accurate predictions about consumer choices and market dynamics.
Properties of Indifference Curves
To gain a deeper insight into consumer behavior, it’s essential to explore the properties of indifference curves. Let’s check below the properties of indifference curves.
-
Convexity of Indifference Curves
One of the defining properties of indifference curves is their convex shape. This convexity to the origin holds profound implications for understanding consumer preferences:
Diminishing Marginal Rate of Substitution (MRS): Convexity implies that as a consumer moves along an indifference curve from left to right, the marginal rate of substitution (MRS) decreases. In simpler terms, the consumer is willing to trade off fewer units of one good for an additional unit of the other as they have more of the latter. This impacts the diminishing marginal utility principle.
Trade-Off Behavior: The convexity of indifference curves signifies that consumers exhibit trade-off behavior when allocating their resources. They are willing to give up more of one good to gain a little extra of the other, but this willingness diminishes as they consume more.
Convexity and Consumer Equilibrium: Consumer equilibrium, where the indifference curve is tangent to the budget constraint, is a crucial concept in microeconomics. The convex shape of indifference curves plays a pivotal role in ensuring that consumers maximize their utility within their budget constraints.
-
Downward Sloping Nature
Indifference curves slope downward from left to right, reflecting another essential property:
Negative Slope: The negative slope of indifference curves indicates the inverse relationship between the two goods being considered. As the consumer consumes more of one good, they are willing to consume less of the other to maintain the same level of satisfaction.
Marginal Rate of Substitution (MRS): The slope of an indifference curve at any point represents the marginal rate of substitution (MRS) at that point. This MRS quantifies how much of one good the consumer is willing to give up to gain an additional unit of the other while remaining equally satisfied.
-
Non-Intersecting Indifference Curves
Indifference curves never intersect with one another:
Uniqueness of Satisfaction: Each indifference curve represents a unique level of satisfaction or utility for the consumer. If two curves were to intersect, it would imply that two different combinations of goods provide the same level of satisfaction, which contradicts the concept of consumer preferences.
Preference Ranking: The absence of intersection between indifference curves allows economists to rank bundles of goods based on consumer preferences. Higher indifference curves indicate greater satisfaction for the consumer.
-
Higher Indifference Curves Represent Higher Satisfaction
Indifference curves are typically drawn in a series, with each curve representing a different level of satisfaction or utility:
Increasing Satisfaction: Higher indifference curves indicate higher levels of satisfaction. As you move outward from the origin to a higher curve, the consumer’s overall satisfaction increases.
Consumer Preferences: Indifference curves help economists understand consumer preferences by showing which combinations of goods provide higher or lower levels of satisfaction. This information is essential for analyzing how consumers allocate their resources.
-
Curvature and Elasticity of Substitution
The curvature of an indifference curve can vary, influencing the elasticity of substitution between goods:
Perfect Substitutes: If indifference curves are linear (straight lines), it implies that the goods are perfect substitutes. In this case, the consumer is willing to trade one good for the other at a constant rate.
Perfect Complements: If indifference curves are L-shaped, it suggests that the goods are perfect complements, and the consumer consumes them in fixed proportions.
Elasticity of Substitution: The curvature of indifference curves reflects the elasticity of substitution between goods. Curves that are more curved indicate lower elasticity, meaning consumers are less willing to substitute one good for another.
The properties of indifference curves are integral to understanding consumer behavior and choices in microeconomics. Their convexity, downward-sloping nature, non-intersecting nature, and representation of satisfaction levels provide valuable insights into how consumers make trade-offs between goods.
These properties underpin key economic concepts like the marginal rate of substitution, consumer equilibrium, and the analysis of consumer preferences. As economists analyze consumer behavior and decision-making, the properties of indifference curves continue to be a foundational and indispensable tool in economic analysis.
See Also: Market Demand Curve | Definition | Graphs | Examples | Limitations
Consumer Equilibrium in Indifference Curves
Consumer equilibrium is a central concept in microeconomics, where consumers aim to maximize their satisfaction or utility given their budget constraints. It lies at the heart of indifference curve analysis, a tool that helps economists understand how individuals make choices among different combinations of goods and services.
-
Introduction to Consumer Equilibrium
Utility Maximization: At its core, consumer equilibrium is about maximizing utility. Utility represents the satisfaction or happiness a consumer derives from consuming goods and services. Achieving equilibrium means making choices that maximize this utility.
Budget Constraints: Consumers operate within budget constraints, meaning they have limited resources to allocate to various goods. Achieving equilibrium involves making choices that yield the highest possible utility within these constraints.
-
The Role of Indifference Curves
Indifference Curves as a Tool: Indifference curves offer a graphical representation of consumer preferences. They help consumers identify bundles of goods that provide the same level of satisfaction. These curves are instrumental in determining consumer equilibrium.
Tangency Condition: The point of consumer equilibrium is where the indifference curve is tangent to the budget constraint line. This tangency condition ensures that the consumer gets the most satisfaction possible given their budget.
-
The Budget Constraint Line
Defining the Budget Constraint: The budget constraint line represents all the affordable combinations of goods given the consumer’s income and the prices of the goods. It’s a straight line in a two-dimensional graph, where one good is plotted on the x-axis and the other on the y-axis.
Budget Equation: The equation for the budget constraint is often written as: Px⋅X+Py⋅Y=I, where Px and Py are the prices of goods X and Y, X and Y represent the quantities consumed, and I is the consumer’s income.
-
Achieving Consumer Equilibrium
Utility and Satisfaction: To reach consumer equilibrium, consumers aim to maximize their utility while staying within their budget constraints. This means choosing a combination of goods that places them on their highest attainable indifference curve.
Tangency Condition: Consumer equilibrium is achieved when the consumer’s highest attainable indifference curve is tangent to the budget constraint line. At this point, the slope of the indifference curve (MRS) is equal to the slope of the budget constraint (/Px/Py).
-
The Significance of the Tangency Point
Maximizing Satisfaction: The tangency point between the indifference curve and the budget constraint line represents the bundle of goods that maximizes the consumer’s satisfaction. It’s the optimal point of consumption.
The Law of Diminishing Marginal Utility: The tangency point also relates to the principle of diminishing marginal utility. At this point, the consumer is allocating their resources in such a way that the marginal utility per dollar spent on each good is equal.
-
Changing Circumstances
Shifts in Budget Constraints: Changes in income or the prices of goods can lead to shifts in the budget constraint line. This, in turn, can result in changes in consumer equilibrium as consumers adapt their consumption choices to new circumstances.
Impact of Preferences: Altering consumer preferences can also affect consumer equilibrium. A shift in preferences may lead consumers to choose different combinations of goods even if their budget constraints remain unchanged.
-
Practical Applications
Policymaking: Understanding consumer equilibrium helps policymakers design effective economic policies, such as taxation, subsidies, or welfare programs. These policies can influence consumer choices and, by extension, market dynamics.
Market Analysis: In market analysis, knowledge of consumer equilibrium is vital for predicting demand changes in response to price fluctuations and shifts in consumer preferences.
Consumer equilibrium in indifference curves represents the delicate balance between consumer preferences and budget constraints. Achieving this equilibrium allows consumers to maximize their satisfaction, making choices that provide the most utility within their financial limitations.
It’s a fundamental concept in microeconomics that plays a crucial role in understanding how individuals make choices, how markets function, and how economic policies can impact consumer behavior. Through the lens of indifference curves and consumer equilibrium, economists gain valuable insights into the complex world of human decision-making.
See Also: Cost and Benefit Analysis | Concepts | Steps | Types | Examples | Challenges
Applications of Indifference Curves
Indifference curves are a fundamental concept in microeconomics, providing a graphical representation of consumer preferences. Beyond their role in theoretical economics, indifference curves have practical applications that extend to market analysis, policymaking, and understanding consumer behavior.
-
Consumer Theory
Optimal Consumption Choices: One of the primary applications of indifference curves is in consumer theory. Indifference curves help economists analyze how consumers make choices based on their preferences. By plotting these curves, analysts can identify the combinations of goods that provide the highest level of satisfaction to consumers.
Consumer Equilibrium: Indifference curves are instrumental in understanding consumer equilibrium. The point at which the indifference curve is tangent to the budget constraint line represents the optimal allocation of resources to maximize utility within the budget.
-
Producer Theory
Cost Minimization: While primarily used in consumer theory, indifference curves also find applications in producer theory. In the context of cost minimization, firms use indifference curves to determine the optimal combination of inputs (like labor and capital) that will minimize production costs while achieving a specific level of output.
-
Public Policy
Taxation and Subsidies: Policymakers often use indifference curves to inform tax and subsidy policies. By understanding how consumers value different goods and how their preferences change with price changes, governments can design taxation systems that minimize the distortion of consumer choices.
Welfare Programs: When designing welfare programs, policymakers take into account how these programs affect the choices and preferences of beneficiaries. Indifference curves help in predicting how individuals will allocate their resources when they receive assistance.
-
Market Analysis
Predicting Demand Changes: Indifference curves play a crucial role in market analysis. Analysts can use these curves to predict how changes in prices and consumer incomes will impact the demand for different goods. This information is vital for businesses to make pricing and production decisions.
Product Differentiation: Understanding consumer preferences through indifference curves aids businesses in product differentiation. Firms can tailor their products to align with consumer preferences, maximizing sales and profits.
-
Evaluating Consumer Welfare
Consumer Surplus: Indifference curves are closely tied to the concept of consumer surplus. This surplus represents the extra satisfaction consumers derive from paying less than the maximum price they are willing to pay for a product. Policymakers use consumer surplus analysis to assess the welfare effects of price changes or market interventions.
Efficiency Analysis: Indifference curves help economists evaluate the efficiency of market outcomes. When markets operate in a way that maximizes consumer welfare within budget constraints, it is considered an efficient allocation of resources.
-
International Trade
Trade Analysis: Indifference curves can be applied to international trade analysis. Economists use these curves to understand how trade affects the choices and preferences of consumers in different countries. They assess how changes in trade policies, tariffs, or quotas impact consumer welfare.
-
Consumer Behavior Studies
Behavioral Economics: In the field of behavioral economics, researchers use indifference curves to understand how psychological factors and deviations from rational decision-making influence consumer choices. This interdisciplinary approach helps explain real-world consumer behavior more comprehensively
Indifference curves are a versatile and powerful tool in economics with diverse applications across various domains. From understanding consumer choices and equilibrium to informing public policies and market strategies, indifference curves continue to be a fundamental concept for economists, policymakers, businesses, and researchers alike.
See Also: The Difference between Micro and Macro Economics
Limitations of Indifference Curve
Along with various applications of indifference curve, there are some limitations, we should know. Let’s check them one by one.
Along with various applications of indifference curve, there are some limitations, we should know. Let’s check them one by one.
-
Cardinal Utility vs. Ordinal Utility
Cardinal Utility Assumption: Indifference curves are often constructed under the assumption of cardinal utility, implying that utility can be measured quantitatively and compared across individuals. This assumption is unrealistic, as utility is a subjective concept that varies from person to person and cannot be objectively quantified.
Ordinal Utility Approach: Some economists argue for an ordinal utility approach, which focuses on ranking preferences rather than quantifying utility. Indifference curves can still be useful in this context, but their interpretation changes, making them less informative about the magnitude of utility differences.
-
Perfect Information Assumption
Perfect Information: Indifference curves assume that consumers have perfect information about product prices, qualities, and their own preferences. In reality, consumers often make choices with imperfect or incomplete information, leading to decisions that may not align with the predictions of indifference curves.
-
Limited to Two Goods
Two-Good Model: The classic indifference curve analysis is limited to scenarios involving only two goods. While this simplifies the graphical representation, it is often insufficient for real-world applications where consumers choose from a wide array of goods and services.
-
Fixed Preferences
Static Preferences: Indifference curves imply that consumer preferences remain constant over time. In reality, consumer preferences can change due to various factors, such as changes in income, demographics, or cultural influences. This dynamic aspect of consumer behavior is not captured by the model.
-
Diminishing Marginal Rate of Substitution (MRS)
Constant MRS: Indifference curves assume a diminishing marginal rate of substitution (MRS), meaning that consumers are willing to trade off goods at a decreasing rate. While this holds true in many cases, there are situations where consumers exhibit constant or even increasing MRS, especially for specific types of goods.
-
Non-Monetary Factors
Ignoring Non-Monetary Factors: Indifference curves primarily consider the influence of prices and income on consumer choices. They often ignore non-monetary factors, such as psychological factors, social influences, and ethical considerations, which can significantly impact real-world decisions.
-
Individual vs. Collective Choices
Collective Decision-Making: Indifference curves are typically applied to individual consumer choices. However, many economic decisions, especially in households or businesses, involve collective decision-making, where preferences of multiple individuals are considered. The framework of indifference curves may not easily extend to such scenarios.
-
Limited Insights into Luxury and Necessity Goods
Luxury vs. Necessity Goods: While indifference curves can reveal consumer preferences and trade-offs, they may not fully capture the complexity of goods categorized as luxury or necessity. Consumers may have inelastic preferences for certain necessities and elastic preferences for luxury items, which indifference curves alone may not adequately represent.
-
Ignoring Externalities and Market Failures
Externalities and Market Failures: Indifference curve analysis typically assumes that markets operate efficiently, ignoring externalities (positive or negative spillover effects) and market failures. These external factors can significantly impact consumer choices and alter the predicted outcomes.
-
Lack of Behavioral Realism
Behavioral Economics: The assumptions behind indifference curves often do not align with the findings of behavioral economics, which reveals systematic departures from classical economic assumptions. Behavioral factors, such as bounded rationality and cognitive biases, can influence choices in ways not accounted for by traditional indifference curves.
While indifference curves are a valuable tool for understanding consumer choices and preferences, they come with limitations that should be recognized when applying this model to real-world economic scenarios.
Indifference Curve | Basic Concepts | Graph | Properties | Types | Applications | Limitations | PDF Free Download |
Conclusion
Indifference curves are a foundational concept in economics that provides valuable insights into consumer behavior and decision-making.
Understanding their properties, the concept of consumer equilibrium, and their applications helps economists and policymakers make informed decisions in a world of limited resources and diverse consumer preferences. Despite critiques and modern developments, indifference curves remain a powerful tool in the economist’s toolkit for unraveling the complexities of choice and preference.