

The concept of the Market Demand Curve is the bedrock of microeconomics, a graphical representation that encapsulates the collective preferences of consumers and guides crucial economic decisions. Let’s check below its definition, graph, importance, examples, and as well as discuss its pivotal role in both business strategies and public policy.
See Also: Indifference Curve Analysis
What is the Market Demand Curve
The market demand curve is a fundamental concept in economics that represents the total quantity of a good or service that consumers in a market are willing and able to purchase at different prices, holding all other factors constant.
It is derived by summing up the individual demand curves of all consumers in the market. Here are different definitions of the market demand curve:
- The market demand curve is a graphical representation showing the relationship between the price of a good or service and the quantity of that good or service demanded by all consumers in a particular market. It slopes downward from left to right, indicating that as the price decreases, the quantity demanded increases.
- The market demand curve is a visual depiction of the cumulative quantities of a product or service that consumers in a market are willing and able to purchase at various price levels, assuming all other factors remain constant. It aggregates the individual demand curves of all buyers in the market.
- The market demand curve is a summary of the demand schedules of all consumers in a given market. It illustrates the inverse relationship between the price of a product and the total quantity demanded by consumers. As prices decrease, the quantity demanded by the market increases.
- The market demand curve is a representation of the total demand for a good or service within a specific market or industry. It shows the quantity of the product that consumers collectively wish to purchase at different price points, revealing the overall demand pattern for that product.
- The market demand curve is a graphical tool used in economics to depict the combined demand of all consumers in a market. It reflects the aggregate response of consumers to changes in the price of a product and is a crucial component of the supply and demand model.
- The market demand curve is an illustration of the relationship between the price of a product or service and the total quantity that consumers in a market are willing to buy at that price. It captures the overall demand behavior of the market’s consumers.
The market demand curve is essential for understanding how changes in price affect the quantity demanded by consumers in a particular market.
It is a fundamental concept in microeconomics and is often used to analyze market behavior, make pricing decisions, and assess the effects of various economic policies on consumer demand.
Individual Demand vs. Market Demand
It’s crucial to differentiate between individual demand and market demand. Individual demand represents the quantity of a product an individual consumer is willing to buy at various price points. Market demand, conversely, is the culmination of all individual demands within a market, providing a macroscopic view of consumer behavior.
Difference Between Individual Demand and Market Demand
Demand is a fundamental concept in economics, serving as the cornerstone upon which the theory of supply and demand is built. When discussing demand, it’s crucial to distinguish between individual demand and market demand. These two concepts represent different perspectives on consumer behavior and have significant implications for businesses, policymakers, and economic analysis.
Individual Demand: A Personal Perspective
Individual demand refers to the quantity of a particular product or service that a single consumer is willing and able to purchase at various price levels over a specified period.
Determinants of Individual Demand
- Price: The most influential factor, causing an inverse relationship with quantity demanded (the Law of Demand).
- Income: Higher income often leads to increased demand for certain goods, especially luxury items.
- Prices of Related Goods: Complementary goods (e.g., coffee and creamer) and substitutes (e.g., tea and coffee) affect individual demand.
- Consumer Preferences: Personal tastes and preferences shape what individuals are willing to purchase.
- Consumer Expectations: Anticipated future changes, like price fluctuations or new product releases, influence current demand.
- Demographics: Age, gender, and other demographic factors can impact individual preferences and, consequently, individual demand.
Elasticity of Individual Demand
The price elasticity of individual demand measures how responsive a single consumer is to changes in the price of a product. It quantifies the percentage change in quantity demanded resulting from a percentage change in price.
For example, if a consumer’s demand for a specific brand of smartphone increases by 10% when the price drops by 5%, the price elasticity of their demand for that smartphone is -2 (elastic).
Market Demand: The Collective Perspective
Market demand, in contrast, represents the total quantity of a specific product or service that all consumers in a particular market are willing and able to purchase at various price levels over a given period.
Determinants of Market Demand
- Price: The aggregate effect of price changes across all consumers in the market.
- Aggregate Income: The total income of all consumers within the market.
- Aggregate Prices of Related Goods: The combined impact of complementary and substitute goods.
- Aggregate Consumer Preferences: A reflection of the combined tastes and preferences of the entire market.
- Market-Wide Expectations: Anticipated market changes can influence overall demand.
- Market Demographics: The demographic composition of the market plays a role in shaping market demand.
Elasticity of Market Demand
Market demand elasticity measures how responsive the entire market is to changes in the price of a product. It reflects the percentage change in the total quantity demanded resulting from a percentage change in price.
The elasticity of market demand can differ from individual demand elasticity, as it accounts for the collective behavior of all consumers in the market.
Practical Applications and Implications
-
Business Strategies
Understanding individual demand helps businesses tailor marketing strategies to target specific consumer segments.
Market demand analysis guides businesses in setting overall pricing strategies and production levels.
-
Policy Decisions
Policymakers use market demand data to inform decisions on taxation, subsidies, and regulations that affect entire industries.
Knowledge of individual demand assists policymakers in designing policies that target specific income groups or demographic segments.
-
Elasticity Insights
Elasticity information aids businesses in setting prices and predicting revenue changes.
Policymakers use elasticity data to assess the impact of tax changes on consumer behavior and revenue.
Individual demand and market demand represent two facets of consumer behavior, each with its unique determinants and implications. While individual demand focuses on the preferences and choices of a single consumer, market demand aggregates these preferences across an entire market. Both concepts are instrumental in shaping business strategies, informing policy decisions, and understanding the complexities of supply and demand dynamics in the ever-evolving world of economics.
Understanding Demand
To comprehend the Market Demand Curve, one must grasp the fundamentals of demand. Demand signifies consumers’ desire and ability to acquire a product at varying price levels. Several factors exert influence over both individual and market demand:
- Price of the Product: The primary factor affecting demand. As prices rise or fall, demand typically moves in the opposite direction, adhering to the Law of Demand.
- Consumer Income: Income levels dictate consumers’ purchasing power. When income increases, demand for certain goods may rise, such as luxury items.
- Prices of Related Goods: Complementary and substitute goods impact demand. Complementary goods, like coffee and creamer, exhibit a positive relationship in demand. Substitutes, such as tea and coffee, experience an inverse relationship.
- Consumer Preferences and Tastes: Ever-changing consumer preferences can dramatically influence demand, leading to shifts in the Market Demand Curve.
- Population and Demographics: Variations in the size and demographics of a population can significantly affect demand. For example, an aging population might create higher demand for healthcare services.
- Consumer Expectations: Anticipated future changes, such as price increases or new product releases, can alter current demand.
Creating the Market Demand Curve
Constructing the Market Demand Curve is an intricate process that involves collecting data on the quantity of a product demanded at various price points. These data points originate from individual consumers, each contributing their own demand curve to the collective market view. Imagine surveying thousands of consumers to determine how much ice cream they’d purchase at different prices. These individual data points can then be aggregated to craft the Market Demand Curve for ice cream in that specific market.
Let’s illustrate this with a hypothetical example. Below is a simplified representation of how the Market Demand Curve for smartphones might be constructed based on survey data:
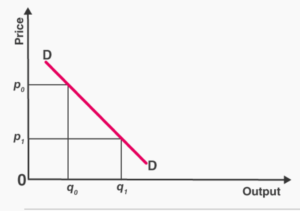
Here, the horizontal axis represents the quantity of smartphones demanded, while the vertical axis denotes the price. The curve slopes downwards, adhering to the Law of Demand, indicating that as prices decrease, the quantity demanded rises.
Shifts in the Market Demand Curve
One of the fundamental aspects of the Market Demand Curve is its adaptability to changing circumstances. Shifts in the curve occur due to alterations in the factors influencing demand. Some common factors leading to shifts include:
- Changes in Consumer Preferences: If consumers suddenly favor smartphones with larger screens, the demand for such phones would increase, shifting the curve to the right.
- Income Changes: When a community experiences an increase in disposable income, there may be greater demand for luxury goods, causing a rightward shift in the demand curve for those products.
- Price Changes of Related Goods: If the price of a complementary good, like smartphone cases, drops significantly, the demand for smartphones might increase, shifting the curve to the right.
- Demographic Shifts: If a city experiences a surge in young professionals, there might be higher demand for products tailored to that demographic, shifting the demand curve accordingly.
Elasticity of Market Demand
Price elasticity of market demand is an essential concept when analyzing the Market Demand Curve. It quantifies how responsive consumers are to price changes. Specifically, it measures the percentage change in quantity demanded resulting from a percentage change in price.
The formula for price elasticity of demand is:
Elasticity = %Change in Quantity Demanded | %Change in Price
Elasticity coefficients help us understand how sensitive demand is to price fluctuations. If elasticity is greater than 1 (|E| > 1), demand is elastic, indicating that consumers are highly responsive to price changes. If elasticity is less than 1 (|E| < 1), demand is inelastic, suggesting that consumers are less responsive.
See Also: Indifference Curve | Table | Explanation | Characteristics
Consider the demand for smartphones. If the price of a popular smartphone model decreases by 10%, and as a result, the quantity demanded increases by 15%, the price elasticity of demand would be:
Elasticity = 15% | – 10% = -1.5
This indicates that the demand for this smartphone is elastic, and price reductions lead to proportionally larger increases in quantity demanded.
Examples of the Market Demand Curve
To appreciate the practicality of the Market Demand Curve, let’s explore some real-world examples:
- Smartphone Market: In the ever-evolving smartphone market, manufacturers and retailers rely heavily on Market Demand Curves to anticipate consumer preferences and set competitive prices.
- Automotive Industry: Car manufacturers analyze market demand to determine the demand for electric vehicles versus traditional gasoline-powered cars, helping them allocate resources and tailor marketing strategies.
- Fast Food Chains: Fast-food restaurants use demand curves to assess the impact of price changes on customer traffic and profitability.
- Housing Market: Real estate professionals and developers utilize Market Demand Curves to gauge the demand for various types of housing in specific regions, aiding in decision-making and resource allocation.
- Entertainment Industry: Movie theaters and concert venues rely on demand curves to set ticket prices, predicting attendance and revenue.
- Healthcare Services: Hospitals and healthcare providers analyze the demand for various medical services to optimize resource allocation and staffing.
These examples highlight how the Market Demand Curve permeates various sectors, guiding critical decisions that ultimately impact businesses and consumers.
Importance of Market Demand Curve
The Market Demand Curve serves as a compass for businesses and policymakers, offering insights that inform crucial decisions. Let’s delve into its significance:
For Businesses:
- Pricing Strategies: Businesses utilize demand curves to determine optimal pricing strategies. They aim to find the price that maximizes revenue or profit.
- Production Planning: Understanding market demand helps businesses forecast production levels, avoiding overproduction or shortages.
- Resource Allocation: Firms allocate resources to meet the demand for different products. The demand curve informs resource allocation decisions.
- Market Positioning: Businesses use demand curves to identify market segments with the highest demand, helping them position products effectively.
For Policymakers:
- Taxation: Policymakers assess the demand elasticity of products to make informed decisions about taxation, aiming to generate revenue without excessively burdening consumers.
- Subsidies: Subsidy allocation relies on demand curves to support industries or goods with inelastic demand.
- Resource Allocation: In public services, understanding market demand helps allocate resources effectively, ensuring public needs are met efficiently.
- Consumer Welfare: Policymakers use demand curves to gauge the impact of regulations, tariffs, or trade policies on consumer welfare.
Market Demand vs. Individual Consumer Preferences
It’s crucial to recognize that the Market Demand Curve represents the collective sentiment of consumers within a market, not individual preferences. While markets may have overarching demand trends, individual consumers can exhibit diverse tastes and needs. Businesses often need to strike a balance between catering to market demand and satisfying individual consumer preferences. This equilibrium is achieved through strategies like product differentiation, customization, or targeting niche markets.
Limitations and Challenges
Constructing and utilizing the Market Demand Curve is not without its limitations and challenges. Some factors that complicate the process include:
- Data Accuracy: The accuracy of data collected from individual consumers can vary, impacting the reliability of the Market Demand Curve.
- Assumptions: The Law of Demand, upon which the demand curve is based, relies on the ceteris paribus assumption, which may not always apply in complex real-world markets.
- Complex Preferences: In markets with intricate consumer preferences, simplifying demand into a single curve may oversimplify reality.
- Dynamic Markets: Some markets are highly dynamic, with rapidly changing consumer trends and behaviors that static data may not capture accurately.
Criticisms and Debates
As with any economic concept, the Market Demand Curve is subject to criticisms and debates:
- Assumptions: Critics argue that the ceteris paribus assumption, which holds that all other factors remain constant, is often unrealistic in the real world.
- Heterogeneous Preferences: In markets with diverse consumer preferences, constructing a single demand curve may not accurately represent the complexity of consumer behavior.
- Behavioral Economics: Insights from behavioral economics challenge the traditional economic model of rational consumer behavior, which underpins the Market Demand Curve.
- Dynamic Markets: The static nature of the Market Demand Curve may not capture the dynamic nature of some markets where preferences and trends change rapidly.
Market Demand Curve | Definition | Graphs | Examples | Limitations | PDF Free Download |
Conclusion
The Market Demand Curve stands as a powerful tool in economics, offering unparalleled insights into consumer behavior, market dynamics, and resource allocation. Its construction, interpretation, and application hold profound implications for businesses, policymakers, and economists alike. By comprehending how individual consumer preferences amalgamate into market-level demand, we gain invaluable insights into the functioning of economies and the choices that consumers make.
In a world of ever-evolving markets and diverse consumer preferences, the Market Demand Curve remains a cornerstone of economic analysis. Its principles continue to guide businesses and policymakers in navigating the complex landscape of supply and demand, assisting them in making informed decisions that impact both individual consumers and society as a whole.
See Also: Law of Demand | Assumptions | Exceptions | Change in Demand