

In economics, few concepts are as fundamental and pervasive as demand, supply, and equilibrium. These three pillars underpin the dynamics of markets, influencing the prices of goods and services, the quantity produced and consumed, and the allocation of resources in our complex global economy.
These concepts are not only essential for economists and policymakers but also for anyone interested in making informed decisions in a market-driven world. Below, this post is all about demand, supply, and equilibrium, unraveling their intricacies, and exploring their real-world applications.
See Also: Market Demand Curve | Definition | Graphs | Examples | Limitations
Definition and Explanation of Demand
In economics, demand refers to the desire and ability of consumers to purchase a specific quantity of a good or service at various price levels during a given period. It’s a multifaceted concept shaped by a multitude of factors.
Factors Influencing Demand
- Price: The most immediate factor influencing demand is price. Generally, there’s an inverse relationship between the price of a product and the quantity demanded. When prices rise, consumers typically demand less of a product, and conversely, when prices fall, demand tends to increase. This is known as the law of demand.
- Consumer Preferences: Consumer tastes, preferences, and perceptions of a product’s value play a significant role in shaping demand. Products that are fashionable, trendy, or have desirable features tend to have higher demand, even at higher prices.
- Income: The income of consumers is a crucial determinant of demand. As consumers’ income rises, they often increase their demand for various goods and services, particularly for normal goods. However, for inferior goods, demand may decline with rising income.
The Demand Curve
One of the most powerful tools for understanding demand is the demand curve. This graphical representation illustrates the relationship between the price of a product and the quantity demanded, assuming all other factors remain constant. The demand curve typically slopes downward from left to right, reflecting the law of demand.
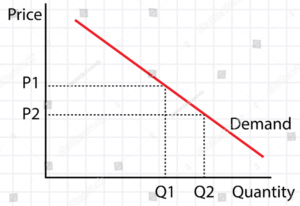
Movements along the demand curve, known as changes in quantity demanded, occur in response to changes in price. For example, if the price of a smartphone decreases, consumers may purchase more of it, leading to a movement along the demand curve. However, shifts of the entire demand curve, called changes in demand, result from alterations in factors other than price, such as changes in consumer preferences or income.
See Also: Properties of Indifference Curve Analysis | Indifference Curves
Supply Definition and Explanation
Supply, in economic terms, refers to the quantity of a good or service that producers are willing and able to offer to the market at different price levels during a specified period.
Factors Affecting Supply
- Production Costs: The costs of producing a good or service significantly influence supply. When production costs rise, producers may reduce the quantity they supply to maintain profitability. Conversely, lower production costs can incentivize higher supply.
- Technological Advancements: Technological progress often enhances production efficiency, enabling producers to supply more at lower costs. Improved technology can lead to increased supply.
- Resource Availability: The availability of key resources, such as raw materials and skilled labor, can impact supply. Shortages or disruptions in resource availability may constrain supply.
The Supply Curve
Similar to demand, supply is represented graphically by the supply curve, which illustrates the relationship between the price of a product and the quantity supplied, assuming all other factors are held constant.
However, unlike the demand curve, the supply curve typically slopes upward from left to right, indicating a positive relationship between price and quantity supplied.
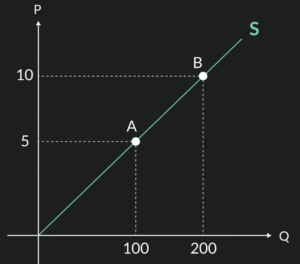
Changes in quantity supplied, or movements along the supply curve, occur due to changes in price. An increase in the price of a good may lead producers to supply more of it, resulting in a movement along the supply curve. Conversely, a price decrease can reduce the quantity supplied.
On the other hand, changes in supply involve shifts of the entire supply curve due to factors other than price. These factors include shifts in production technology, resource availability, and government policies.
Market Equilibrium Definition & Explanation
Now that we have explored the concepts of demand and supply, we can move towards equilibrium. When demand and supply become equal on some specific price, this is calling market equilibrium. In other words, it’s the point at which supply and demand intersect.
Determining Equilibrium
Equilibrium price and quantity are determined by the forces of supply and demand. When the demand for a product exceeds its supply, there’s upward pressure on prices. Conversely, when supply increases and demand decreases, prices tend to fall.
Graphical Representation of Equilibrium
Equilibrium is beautifully represented graphically as the point at which the demand curve and supply curve intersect. At this point, the quantity demanded equals the quantity supplied, and there’s no tendency for prices to rise or fall.
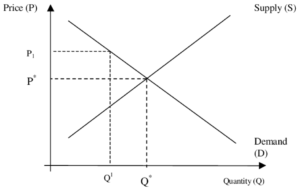
Market equilibrium is a dynamic concept. If external factors change, such as consumer preferences or production technology, the equilibrium price and quantity will adjust accordingly. This dynamic nature is a fundamental characteristic of market economies.
See Also: What is Law of Demand | Assumptions | Exceptions | Change in Demand
Impact of Changes in Demand
Let’s see how changes in demand affect market equilibrium:
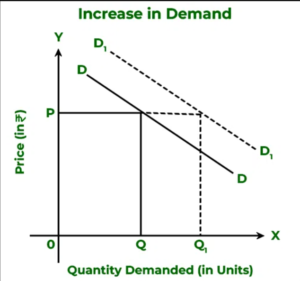
- Increase in Demand: If consumer preferences shift or if income levels rise, the demand for a product may increase. This results in higher prices and a greater quantity sold in the market.
- Decrease in Demand: Conversely, a decrease in demand, often due to changing consumer tastes or economic downturns, can lead to lower prices and reduced quantities sold.
Impact of Changes in Supply
Changes in supply can also have significant effects on equilibrium:
- Increase in Supply: If technological advancements lead to lower production costs, suppliers may increase their output, leading to greater supply. This can result in lower prices and higher quantities sold in the market.
- Decrease in Supply: Factors like resource shortages or increased production costs can reduce supply. As a result, prices may rise, and the quantity available in the market may decrease.
Shifts in Supply and Demand Curves
It’s essential to distinguish between movements along the supply and demand curves and shifts of the entire curves. Changes in quantity supplied or demanded involve movements along the curves in response to price changes.
In contrast, changes in supply or demand result from alterations in factors other than price. Let’s explain this with an example:
Suppose there’s an increase in consumer income, leading to higher demand for luxury cars. This would cause a shift of the demand curve to the right, as shown below:
Conversely, if a technological breakthrough reduces the cost of producing solar panels, leading to an increase in their supply, the supply curve would shift to the right:
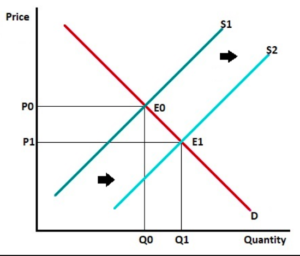
These shifts in supply and demand curves affect both equilibrium price and quantity. In the first example, the equilibrium price and quantity of luxury cars rise, while in the second example, the price of solar panels falls, and more are sold in the market.
Price Ceilings and Price Floors
Governments sometimes intervene in markets through policies like price ceilings and price floors. These interventions aim to influence market outcomes, often with the intent of achieving specific social or economic goals.
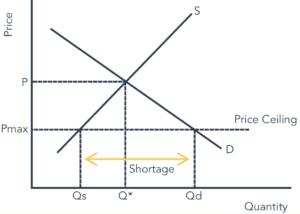
Price Ceilings: A price ceiling sets a maximum legal price for a good or service, typically below the equilibrium price. The aim is to protect consumers by preventing prices from rising too high, especially for essential goods. However, price ceilings can lead to shortages and reduce the incentive for producers to supply the product.
Examples of price ceilings include rent control in housing markets and government-imposed maximum prices for certain medications.
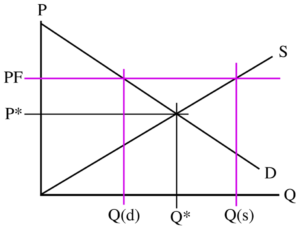
Price Floors: Conversely, a price floor establishes a minimum legal price for a good or service, often set above the equilibrium price. Price floors are often used to support producers, ensuring they receive a fair income. However, they can result in surpluses if the floor price is higher than the market equilibrium.
Common examples of price floors include minimum wage laws and agricultural price supports.
Elasticity and Its Role
Elasticity is a critical concept that further enriches our understanding of demand and supply. Elasticity measures the responsiveness of quantity demanded or supplied to changes in price or income. It quantifies how sensitive consumers and producers are to price fluctuations.
See Also: What is Elasticity of Demand | Determinants | Types | Importance
Price Elasticity of Demand (PED)
Price elasticity of demand let you know change in demand as result of change in price. It is calculated as follows:
PED = %Change in Quantity Demanded | %Change in Price
The result of this calculation tells us how responsive consumers are to changes in price:
- If PED>1, demand is elastic, meaning that consumers are highly responsive to price changes. A small price increase leads to a proportionally larger decrease in quantity demanded, and vice versa.
- If PED<1, demand is inelastic, indicating that consumers are less responsive to price changes. Quantity demanded changes proportionally less than price.
- If PED=1, demand is unitary elastic, implying that percentage changes in price and quantity demanded are equal.
Price elasticity of demand has several practical implications. For instance, products with elastic demand are more sensitive to price changes, allowing firms to adjust prices to maximize revenue. In contrast, products with inelastic demand may have less price flexibility.
Price Elasticity of Supply (PES)
On the supply side, the price elasticity of supply measures how much the quantity supplied responds to changes in price. It is calculated as follows:
PES= %Change in Quantity Demanded | %Change in Price
Similar to price elasticity of demand, the value of PES helps us understand how sensitive producers are to price changes:
- If PES>1, supply is elastic, indicating that producers are highly responsive to price changes. A small price increase leads to a proportionally larger increase in quantity supplied, and vice versa.
- If PES<1, supply is inelastic, suggesting that producers are less responsive to price changes. Quantity supplied changes proportionally less than price.
- If PES=1, supply is unitary elastic, meaning that percentage changes in price and quantity supplied are equal.
Price elasticity of supply is particularly relevant for businesses that need to adjust production levels in response to changes in market conditions. For example, if a company can quickly increase production when prices rise, its supply is considered elastic.
Market Adjustments
When external factors change, markets adjust to establish a new equilibrium. For example, suppose a series of poor harvests leads to a decrease in the supply of coffee beans. This reduction in supply pushes prices higher.
As a result, consumers may reduce their coffee consumption, while producers are incentivized to plant more coffee trees. These market adjustments eventually lead to a new equilibrium with higher coffee prices and quantities than before.
Feedback Mechanisms
The dynamic nature of markets is driven by feedback mechanisms. As prices rise, they signal higher profits for producers, attracting more resources and investment into the industry. Conversely, falling prices may lead to reduced production and resource allocation. These feedback loops help stabilize markets over time.
Examples of Demand, Supply & Equilibrium
After seeing the basic concepts of demand, supply, and equilibrium, let’s explore its application across various industries and sectors.
- Agriculture: Agriculture is heavily influenced by supply and demand dynamics. Factors like weather, changing consumer preferences, and global trade agreements can affect the supply of crops and livestock, leading to price fluctuations.
- Technology: The technology industry is characterized by rapid innovation and shifts in consumer demand. Products like smartphones and laptops experience frequent changes in demand and supply as new models are released and consumer preferences evolve.
- Finance: Financial markets, including stock and commodity markets, are driven by supply and demand for financial assets. Changes in economic conditions, investor sentiment, and government policies can lead to market fluctuations.
- Housing: Real estate markets are influenced by both supply and demand. Factors like population growth, urbanization, and interest rates affect both the supply of housing units and the demand for them, impacting property prices.
- Labor Markets: Labor markets are subject to changes in supply and demand for different types of labor. Technological advancements, changes in education, and shifts in industry demand can influence labor market equilibrium and wages.
Demand, Supply and Equilibrium: A Comprehensive Guide | PDF Free Download |
Conclusion
Demand, supply, and equilibrium are central concepts in economics that govern the functioning of markets. Understanding how these concepts interact and influence one another is crucial for making informed decisions in the world of business, policy, and personal finance.
Demands represent the desires and preferences of consumers, while supply reflects the willingness and ability of producers to provide goods and services. The intersection of these forces results in market equilibrium, where prices and quantities are determined.
Market dynamics are not static; they respond to changes in external factors. Shifts in supply and demand, along with price adjustments, are essential features of dynamic markets. The concept of elasticity further enriches our understanding by quantifying the responsiveness of consumers and producers to price changes.
In a world characterized by constant change, understanding these economic principles empowers individuals, businesses, and governments to adapt and thrive in the face of evolving market conditions. From agriculture to technology, finance, housing, and labor markets, the principles of demand, supply, and equilibrium are ubiquitous and indispensable in our daily lives.
As we continue to navigate the complexities of our global economy, these foundational concepts will remain invaluable tools for decision-makers seeking to navigate the ever-shifting landscape of supply and demand.
See Also: Law of Supply | Graph | Table | Assumptions | Limitations | Elasticity